16
Aug
2018

By navigating in the main menu to WooCommerce Reports we’ll be able to take a look at the reporting capabilities that WooCommerce has available.
It delivers a number of standardized reports that already give a lot of information but unfortunately, there isn’t much flexibility in this area.
Just use what is available or find alternative reporting methods. When opening the reporting page, we’ll see four main areas that are divided by tabs:
Every main area contains several reports. By default, the reporting section always opens with the Sales by date report of the last seven days. The following reports of sales orders are available:
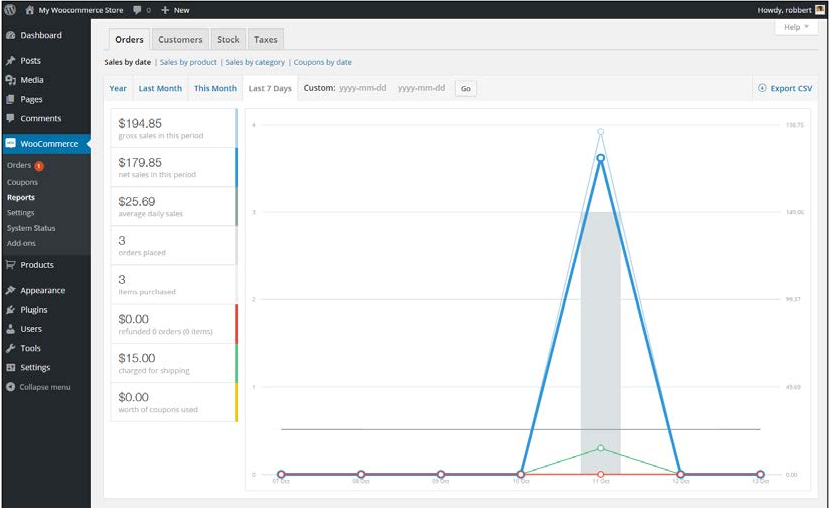
For every Sales report, it is possible to select the date range. By default, this is the Last 7 days, but other possibilities are This Month, Last Month, and the current Year. Besides that, it’s possible to enter a custom date range. Click on the Go button after entering the start and end date. WooCommerce automatically selects a matching period so that the graph can be drawn. For instance, when selecting a period of a year or more, WooCommerce will show the revenue per month in the graph.
On the top right of the screen, there’s a button named Export CSV. If you click it, a file will be created holding the data of your graph so that you can import it to, say, for example, Excel. Note that this is already aggregated data per period and no individual sales orders will be exported here
In the Customers report section, two reports are available:
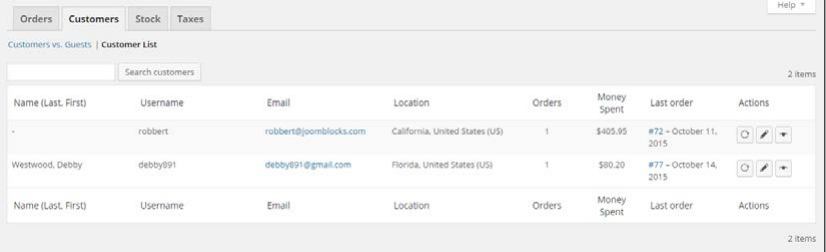
The customers versus guests reports give the ratio of buyers that did and did not create an account in your store. The second report, customer list, is more interesting because it shows your top buyers. Unfortunately, customers that do not have an account in your store will not be shown on this list.
There are three different stock reports available:
All three reports are generally the same; the only difference is the filter that determines which items will be shown:

The example above shows the Most Stocked report, which sorts all the products with the available stock. The highest stock level shows on top of the report. You may navigate to the product details in as well the frontend as the backend by using the icons on the right.
Stores working with lots of products will have an issue with the limitations of these reports. It isn’t possible to export the data or search within the report.
The Taxes area contains the following reports:
It shows the sales tax that has been calculated for your orders. For both reports, you can set the date range. The Taxes by code report splits the sales tax per code, which is handy if you’re working with different tax rates for your products. The Taxes by date report shows the tax totals per month, regardless of the used tax codes.